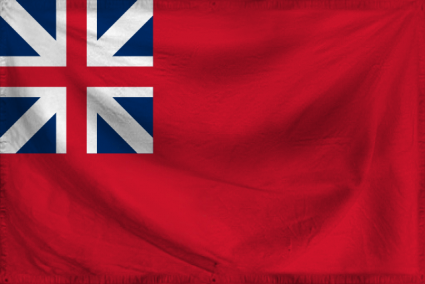
The Colony of Massachusetts Bay
Ense Petit Placidam, Sub Libertate Quietem
Region: the West Pacific
Quicksearch Query: Massachusetts Bay
|
Quicksearch: | |
NS Economy Mobile Home |
Regions Search |
Massachusetts Bay NS Page |
|
| GDP Leaders | Export Leaders | Interesting Places BIG Populations | Most Worked | | Militaristic States | Police States | |

Ense Petit Placidam, Sub Libertate Quietem
Region: the West Pacific
Quicksearch Query: Massachusetts Bay
| Massachusetts Bay Domestic Statistics | |||
|---|---|---|---|
| Government Category: | Colony | ||
| Government Priority: | Social Welfare | ||
| Economic Rating: | Good | ||
| Civil Rights Rating: | Very Good | ||
| Political Freedoms: | Superb | ||
| Income Tax Rate: | 14% | ||
| Consumer Confidence Rate: | 102% | ||
| Worker Enthusiasm Rate: | 105% | ||
| Major Industry: | Beef-Based Agriculture | ||
| National Animal: | eagle | ||
| Massachusetts Bay Demographics | |||
| Total Population: | 888,000,000 | ||
| Criminals: | 97,277,011 | ||
| Elderly, Disabled, & Retirees: | 122,686,498 | ||
| Military & Reserves: ? | 31,610,367 | ||
| Students and Youth: | 151,404,000 | ||
| Unemployed but Able: | 140,318,603 | ||
| Working Class: | 344,703,521 | ||
| Massachusetts Bay Government Budget Details | |||
| Government Budget: | $1,876,193,403,535.36 | ||
| Government Expenditures: | $1,838,669,535,464.65 | ||
| Goverment Waste: | $37,523,868,070.71 | ||
| Goverment Efficiency: | 98% | ||
| Massachusetts Bay Government Spending Breakdown: | |||
| Administration: | $147,093,562,837.17 | 8% | |
| Social Welfare: | $386,120,602,447.58 | 21% | |
| Healthcare: | $257,413,734,965.05 | 14% | |
| Education: | $275,800,430,319.70 | 15% | |
| Religion & Spirituality: | $0.00 | 0% | |
| Defense: | $257,413,734,965.05 | 14% | |
| Law & Order: | $239,027,039,610.41 | 13% | |
| Commerce: | $18,386,695,354.65 | 1% | |
| Public Transport: | $147,093,562,837.17 | 8% | |
| The Environment: | $18,386,695,354.65 | 1% | |
| Social Equality: | $73,546,781,418.59 | 4% | |
| Massachusetts BayWhite Market Economic Statistics ? | |||
| Gross Domestic Product: | $1,564,830,000,000.00 | ||
| GDP Per Capita: | $1,762.20 | ||
| Average Salary Per Employee: | $3,160.27 | ||
| Unemployment Rate: | 24.33% | ||
| Consumption: | $6,137,764,904,960.00 | ||
| Exports: | $903,511,375,872.00 | ||
| Imports: | $977,516,822,528.00 | ||
| Trade Net: | -74,005,446,656.00 | ||
| Massachusetts Bay Non Market Statistics ? Evasion, Black Market, Barter & Crime | |||
| Black & Grey Markets Combined: | $1,539,185,740,908.48 | ||
| Avg Annual Criminal's Income / Savings: ? | $1,280.15 | ||
| Recovered Product + Fines & Fees: | $150,070,609,738.58 | ||
| Black Market & Non Monetary Trade: | |||
| Guns & Weapons: | $55,425,693,733.68 | ||
| Drugs and Pharmaceuticals: | $85,118,029,662.44 | ||
| Extortion & Blackmail: | $35,630,803,114.51 | ||
| Counterfeit Goods: | $83,138,540,600.52 | ||
| Trafficking & Intl Sales: | $33,651,314,052.59 | ||
| Theft & Disappearance: | $71,261,606,229.02 | ||
| Counterfeit Currency & Instruments : | $110,851,387,467.36 | ||
| Illegal Mining, Logging, and Hunting : | $19,794,890,619.17 | ||
| Basic Necessitites : | $120,748,832,776.94 | ||
| School Loan Fraud : | $61,364,160,919.43 | ||
| Tax Evasion + Barter Trade : | $661,849,868,590.65 | ||
| Massachusetts Bay Total Market Statistics ? | |||
| National Currency: | dollar | ||
| Exchange Rates: | 1 dollar = $0.18 | ||
| $1 = 5.53 dollars | |||
| Regional Exchange Rates | |||
| Gross Domestic Product: | $1,564,830,000,000.00 - 50% | ||
| Black & Grey Markets Combined: | $1,539,185,740,908.48 - 50% | ||
| Real Total Economy: | $3,104,015,740,908.48 | ||
| the West Pacific Economic Statistics & Links | |||
| Gross Regional Product: | $239,455,404,688,408,576 | ||
| Region Wide Imports: | $30,314,224,920,035,328 | ||
| Largest Regional GDP: | BIteland | ||
| Largest Regional Importer: | BIteland | ||
| Regional Search Functions: | All the West Pacific Nations. | ||
| Regional Nations by GDP | Regional Trading Leaders | |||
| Regional Exchange Rates | WA Members | |||
| Returns to standard Version: | FAQ | About | About | 484,119,000 uses since September 1, 2011. | |
Version 3.69 HTML4. V 0.7 is HTML1. |
Like our Calculator? Tell your friends for us... |